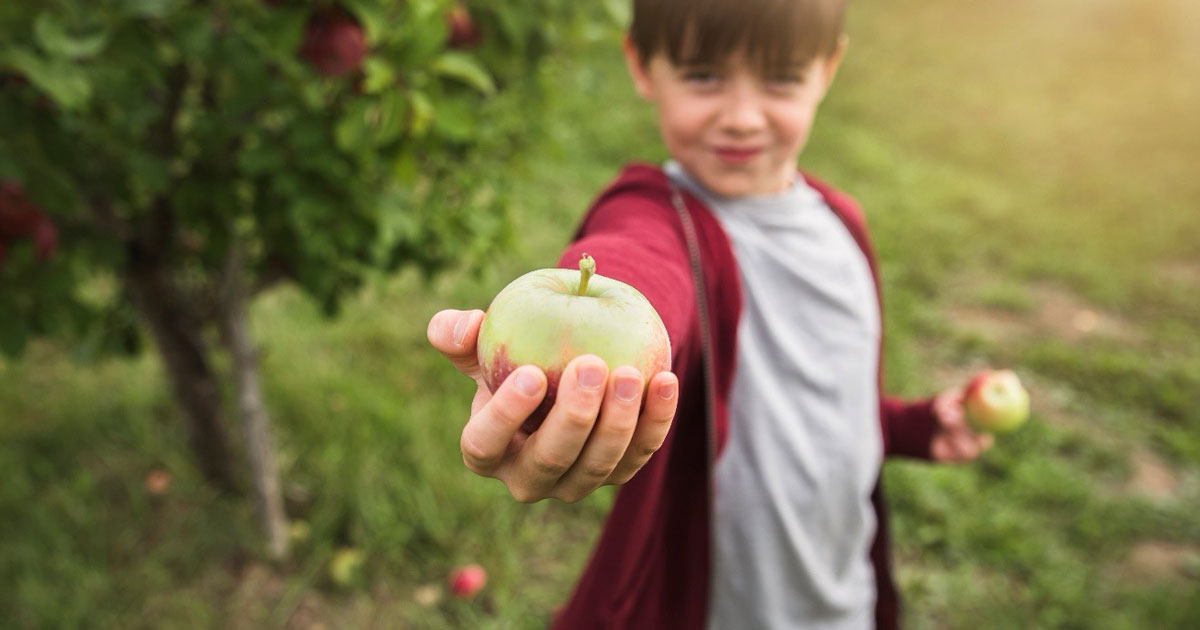
Each crop season we’re asked different versions of the same question: “What does this year’s crop look like?”
Earlier in the summer this question was posed about cherries. It was one of the first indications of how the unfavorable weather in the European Union, and the uncertainty of tariffs, would affect things here in the United States. Specifically, we saw a direct impact with how those two combined elements caused higher costs.
Most recently the questions have been about blueberry and raspberry, where we are seeing a similar narrative from what we say with cherries. Bad weather overseas, coupled with higher costs due to tariffs, is creating a higher demand for domestic crops, and are resulting in higher prices. But this post is about apple, and it’s the perfect time to dig in to what we’ve heard and learned at this year’s annual USApple Outlook event (2025) in Chicago. Let’s take a deeper look at the data.
One of the phrases that was repeated over and over again is that the U.S. crop is estimated to be a good one. It was described as a “wave of apples!”
The 2025 USApple Industry Outlook Report anticipates a 6% increase in U.S. apple production for the 2025-26 crop year, reaching 290 million bushels.
As always, Washington State remains the nation’s leader for U.S. apple production and is currently estimated to produce 190 million bushels, up roughly 7% from the prior season. This means that roughly 66% of the apples produced in the United States will come from Washington!

This isn’t an accident! Washington has added 13,000 net new bearing acres since 2015. The average yield per acre is 1,024 bushels—the highest among the major apple producing states in the country.
Traditionally, 76% of the apples go to fresh market, while 20% typically go to processing (slices, dices, chunks, juice, etc.). However, it’s worth mentioning that there is concern from growers statewide over increasing labor costs and other shifting market dynamics that are straining profitability and sustainability.
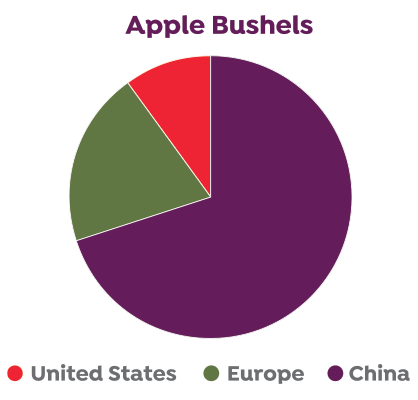
We’re incredibly proud to be among the nation’s leaders in apple production. Unfortunately, the U.S. output is not as robust as some of our global counterparts. If you’re curious on how things compare globally, here’s a look.
To translate the earlier numbers into something everyone can better understand, here’s what that data would look like if we used “seconds” instead of “bushels,” and here’s a look at things in seconds – days – years:
• 2 Billion Seconds
= 23,148 days
= 63.4 years
• 560 Seconds
= 6,481 days
= 17.75 years
• 290 Seconds
= 3,356 days
= 9.2 years
It’s almost certain that the added pressure on the domestic crop will result in higher pricing this year. What’s unknown is how the EU and China will respond in the global marketplace.
Pricing indications seem to be rolling out at a glacial pace, but the one thing we’re all certain of is that U.S. apples are going to be VERY popular this year.
At FruitSmart, we continue to run apples 360 days a year to support as much demand as possible. We’re keen to take care of all/most of our customers, both big and small.
You’ll want to book your volume early this season, even if it means not having a firm idea on the pricing, so please contact us with your needs.